
Power BI is a powerful data visualization and business intelligence tool that allows users to create interactive reports and dashboards. Central to its functionality is the concept of semantic models, which provide the underlying data structure and relationships to make data analysis intuitive and efficient.
Power BI semantic models define an analytical domain with metrics and business-friendly terminology to enable deeper analysis. These models are typically star schemas, with fact tables representing the domain and dimensions used to analyze, filter, and drill down into data. The semantic model is automatically created, with users selecting tables, relationships, and measures, while inheriting business logic from a parent Warehouse. This streamlines downstream analytics for business intelligence in a managed, optimized, and synchronized environment.
These semantic models serve as a ready source for reporting, visualization, and data discovery. Key features include expanding warehouse constructs with hierarchies and relationships, cataloging and searching models in the Data Hub, setting permissions, creating standardized metrics, and integrating with tools like Excel or Tableau for further analysis.
Why Use Semantic Models?
We use Semantic Models to:
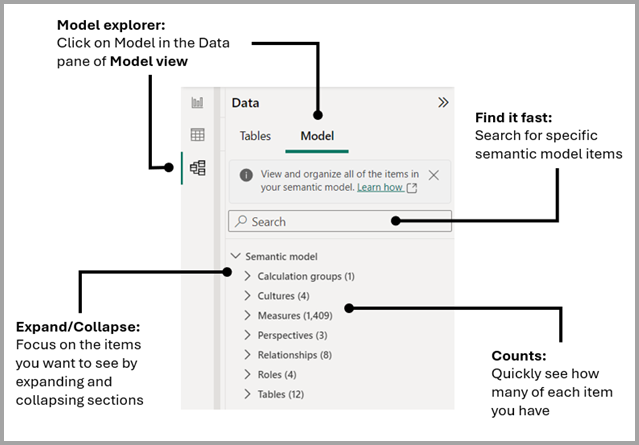
The Model Explorer in Power BI's Model view allows you to explore and manage complex semantic models, including:
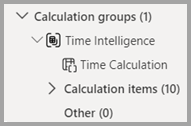
Calculation groups
Calculation groups help minimize the need for redundant measures by letting you define DAX expressions as calculation items that can be applied to existing measures in your model.
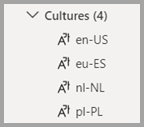
Cultures
In the Cultures area of Model explorer, you can view all translated versions of the data model. An object can have multiple translations of a name or description, making it possible to support multi-language versions within the model definition.
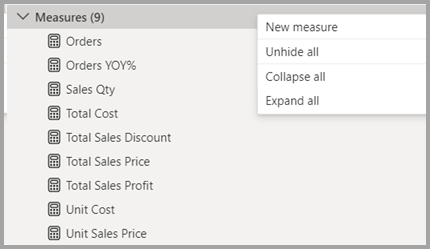
Measures
Measures help you by performing calculations on your data as you interact with your reports. You can create or edit a measure and view all the measures in your model together, even when they reside in different tables or folders.
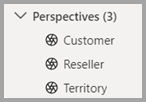
Perspectives
Perspectives, in tabular models, define viewable subsets of a model that provide focused, business-specific, or application-specific viewpoints of the model.
Relationships
You can create or edit relationships between tables in Model explorer.
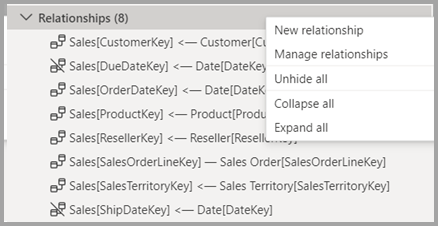
You can establish connections between tables to create a cohesive model:
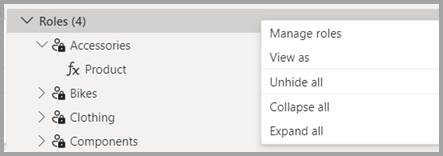
Roles
You can create or edit security roles (RLS) in Model explorer.
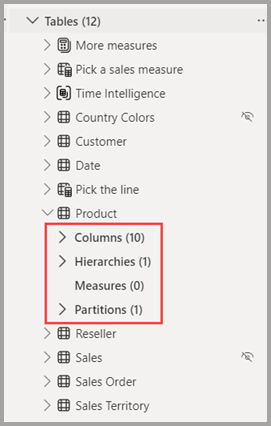
Tables
You can create or edit tables in your model in Model explorer. The approach is similar to the Tables area in the Data pane, but the information here in Model explorer includes subsections for each table, organizing your items.
Table partitioning in Delta tables organizes rows into subsets stored in Parquet files, improving query and write performance. For large datasets, such as two years of sales data, partitioning can significantly speed up operations by spreading rows across multiple partitions based on a key like month/year. For Delta tables serving semantic models, it's often better to avoid partitioning and rely on Fabric for file management to enhance query performance through parallelization.
Data modeling is one of the most important aspects of Power BI as it shapes how your data will interact with each other, and it also impacts performance. This is where the core structure of your report is created.
Relationships:
The relationships between tables define how data can be joined. Power BI uses cardinality to define the relationship types:
Star Schema vs. Snowflake Schema:
A star schema is an ideal design for data models where you have one central fact table (e.g., sales) and multiple dimension tables (e.g., date, product, geography). This model improves reporting performance. The snowflake schema is a more normalized version, where dimension tables may be further broken down into sub-dimensions.
Data Granularity:
The level of detail in your data (e.g., hourly, daily, monthly). It’s essential to ensure the granularity of the data in your model matches your reporting requirements.
DAX (Data Analysis Expressions):
DAX is Power BI's formula language that enables the creation of custom calculations. DAX allows for:
DAX can become quite advanced, supporting complex business logic and aggregations.
Clean Data:
Use Power Query Editor to transform and shape data.
Naming Conventions
Optimized Relationships
Efficient DAX
Power BI allows you to schedule automatic data refreshes, ensuring that the data in your reports is always up to date. Depending on your Power BI license, you can schedule data refreshes multiple times a day.
DirectQuery allows real-time data access in Power BI without importing data, but it has limitations such as slower performance, fewer transformation options, and restricted data modeling features. Not all data sources support it, and query complexity may be limited
For Import mode, once the report is published, Power BI will refresh the data periodically based on the refresh schedule you define. We recommend setting the refresh to occur once per day.
Use Cases
Advanced Techniques
Common Issues
Tools for Optimization
For reporting purposes, when constructing semantic models, it’s crucial to adopt best practices that not only align with traditional methods like those used in Power BI but also take advantage of the unique capabilities Microsoft Fabric offers. Here's a set of recommendations and comparisons with traditional Power BI approaches:
Use Star Schemas and take care of relationships and cardinality
Star schemas are ideal for semantic model design in Power BI. It separate fact tables from dimension tables, improving query performance and clarity.
Avoid many-to-many and bi-directional relationship and resolve Relationship dependencies
Many-to-many relationships should be avoided at any cost. It multiples the value of measures and shows wrong value for them. It also does not support the DAX related () function. Although technically it can work with applying correct filters, it creates confusion for the end users, which might be difficult for maintenance. Typically, when we join 2 fact tables, which ideally should never be joined directly, many-to-many relationships occurs. Below, we have a section covering how to join 2 fact tables.
Create Measure for KPIs
Use measures over calculated columns to reduce data redundancy and enhance performance with DAX.
Store the measures inside a "Measures folder" with proper naming convention
Create a common Calendar Table
A common business requirement is to make calculations based on date and time. Organizations want to know how their business is doing over months, quarters, fiscal years, and so on. For this reason, it is crucial that these time-oriented values are formatted correctly.
To use the DAX (Data Analysis Expressions) Time Intelligence functions, there's one prerequisite: your model must include at least one date table.
The date table must be marked as a date table, and be lined to others table using date (or datetime) columns
Semantic models are the backbone of effective Power BI reports and dashboards. By mastering the principles and techniques outlined in this booklet, you can unlock the full potential of Power BI to deliver insightful and impactful analytics.